You chase likes on Instagram or Twitter. They feel good at first. But soon, you see they don’t pay bills. Vanity metrics like follower counts or simple thumbs-up hide the real story. They trick you into thinking your posts work when they don’t drive sales or build loyalty. True wins come from metrics tied to business goals, like revenue or customer care.
Chasing likes on Instagram or Twitter feels good, but they don’t pay bills. Discover 5 metrics that prove your social media strategy.
Engagement Rate: Quality Over Quantity in Audience Interaction
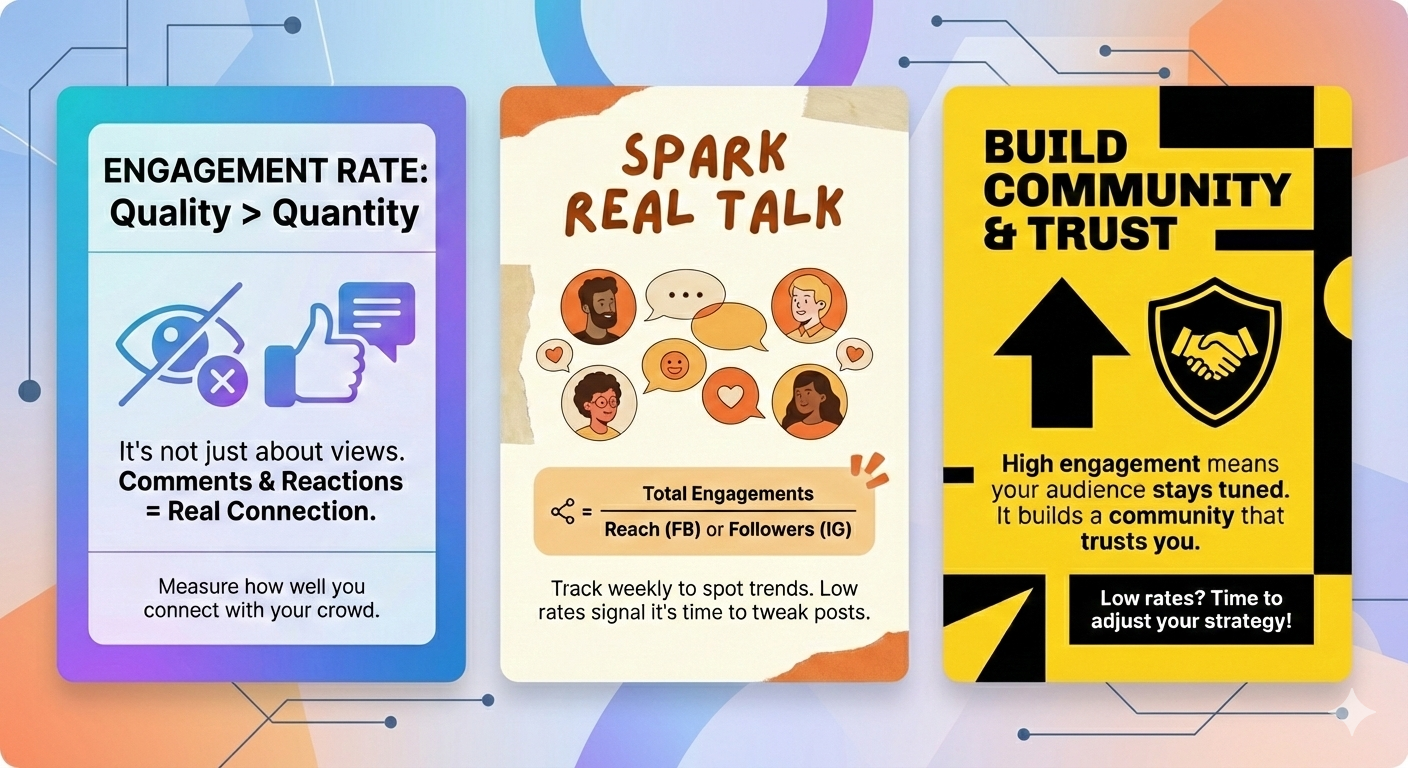
Engagement rate tells you if your content sparks real talk. It’s not just about views. People who comment or react show they care about your message. This metric beats raw numbers because it measures how well you connect with your crowd.
Focus on interactions like comments and reactions. Divide total engagements by your reach or followers. Platforms like Facebook use reach for ads, while Instagram favors follower-based checks for organic posts. Track it weekly to spot trends.
High engagement means your audience stays tuned. It builds a community that trusts you. Low rates signal it’s time to tweak your posts.
Calculating True Engagement: Reach vs. Follower Based Metrics
Use reach for campaign checks. It shows how many unique eyes saw your post. Then, divide interactions by that number. This gives a clear picture of impact during promotions.
Follower-based metrics suit daily community health. Take total likes, comments, and shares. Divide by your total followers. Multiply by 100 for a percentage. Aim for 1-3% on most platforms.
Why pick one over the other? Reach works best for new audiences. Follower counts track loyalty in your core group. Tools like Google Analytics help blend both views.
The Power of Meaningful Interactions (Saves and Shares)
Saves beat likes every time. They show users find value for later. A recipe post with many saves means people plan to cook it. Shares spread your word like wildfire. They turn fans into promoters.
Boost saves with how-to guides or tips lists. Shares love emotional stories or funny memes. Track these in your analytics dashboard.
One brand saw shares jump 40% after user polls. That led to more organic traffic. Prioritize content that invites these actions. Your engagement rate will soar.
Conversion Rate: Tying Social Activity Directly to Revenue
Conversion rate links your posts to cash. It’s the percentage of social visitors who buy or sign up. Execs love this because it shows dollars from your efforts. Set up tracking right. Use UTM tags on links. They mark traffic from specific posts.
Pixels from Facebook or LinkedIn track actions on your site. Without this, you guess at results. With it, you prove social drives sales. Test different calls to action to lift rates.
Lead Quality Assessment from Social Referrals
Look past the click. Check if social leads turn into customers. Track from marketing qualified lead to sales qualified. How many Instagram clicks became paying clients?
Use CRM tools to tag sources. One campaign might yield 20 leads, but only five close. That’s a 25% rate. Compare across channels.
Quality beats quantity. Social leads often need nurturing. Email follow-ups can double conversions from these sources.
Cost Per Acquisition (CPA) Benchmarking on Paid Social
Paid ads need tight CPA control. Calculate it by dividing ad spend by new customers. Keep it under your customer’s lifetime value. Benchmark against industry norms. E-commerce aims for $20-50 CPA. Optimize by testing ad copies and audiences.
One tip: Pause underperformers fast. Shift budget to winners. This drops CPA by 30% in months. Track it monthly for steady gains.
Amplification Rate: Measuring Your Audience’s Advocacy
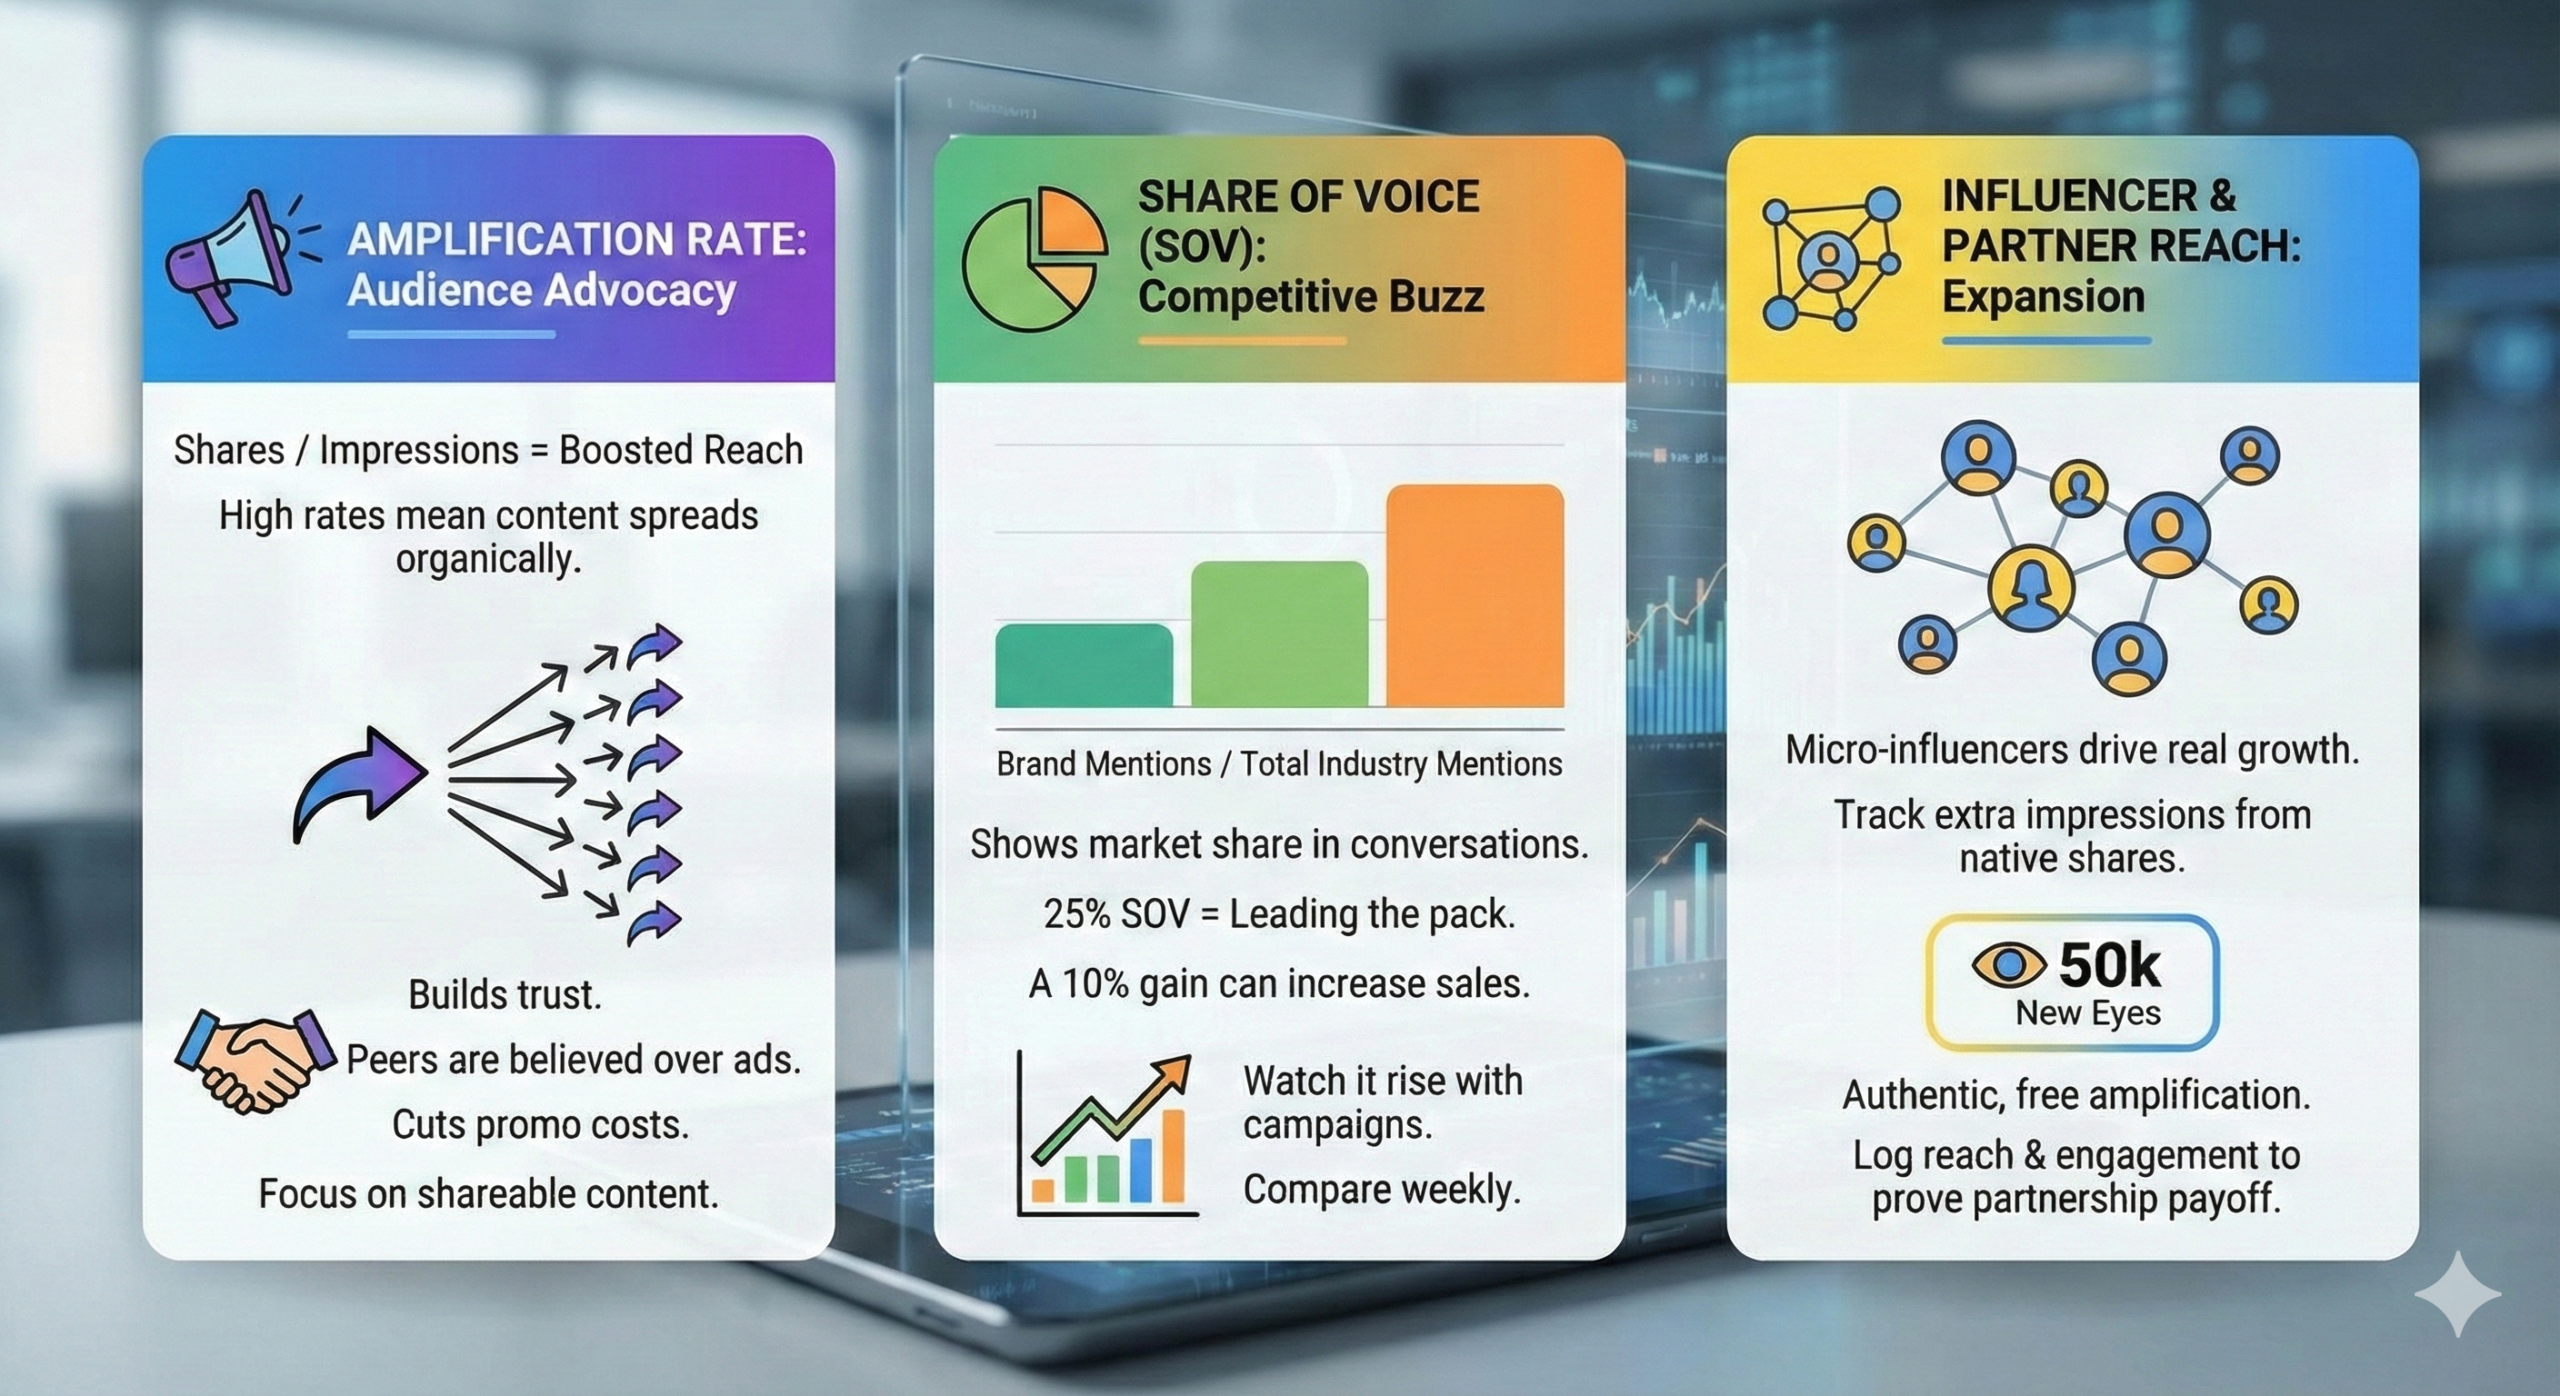
Amplification rate spots when fans boost your reach. It’s shares divided by impressions. High rates mean your content spreads on its own.
This builds trust. People believe peers more than ads. Track it to see loyalty grow. Loyal fans amplify your voice. They cut your promo costs. Focus on content that excites them to share.
Share of Voice (SOV) as a Competitive Indicator
- SOV measures your buzz against rivals. Count brand mentions in industry chats. Divide by total mentions for a percentage.
- Tools like Brandwatch track this. If you hit 25% SOV, you’re leading the pack. It shows market share in talks.
- Watch it rise with campaigns. A 10% SOV gain can mean more sales. Compare to top competitors weekly.
Tracking Influencer and Partner Reach Expansion
Micro-influencers drive real growth. Track when they share your posts. Measure the extra impressions they add. Native shares feel authentic. One partner post reached 50,000 new eyes. That’s free amplification.
Log these in spreadsheets. Note reach and engagement. It proves partnerships pay off. For tips on building ties, check veteran marketer strategies.
Customer Retention and Support Deflection Rate
Social handles more than fun posts. It cuts support costs now. Deflection rate shows queries solved via social instead of calls. This saves money. One resolved tweet avoids a $10 phone call. Track it to see efficiency. Retention grows when you help fast. Happy customers stick around. Measure deflection as social resolutions over total tickets.
Response Time and Resolution Rate on Support Channels
Quick replies build trust. Aim for under 1 hour on DMs. Track average first response time. Resolution rate counts fixed issues on first contact. High rates mean fewer follow-ups. Tools like Hootsuite monitor this. One company cut response to 30 minutes. CSAT scores jumped 20%. Train your team for this win.
Sentiment Analysis on Brand Mentions
Sentiment tools scan talks for positive vibes. Count happy vs. sad mentions. Post-campaign, positives should rise.
Free tools like Google Alerts start you off.
Paid ones like Mention dig deeper. A campaign lifted sentiment to 80% positive. That boosted repeat buys. Watch trends to tweak your approach.
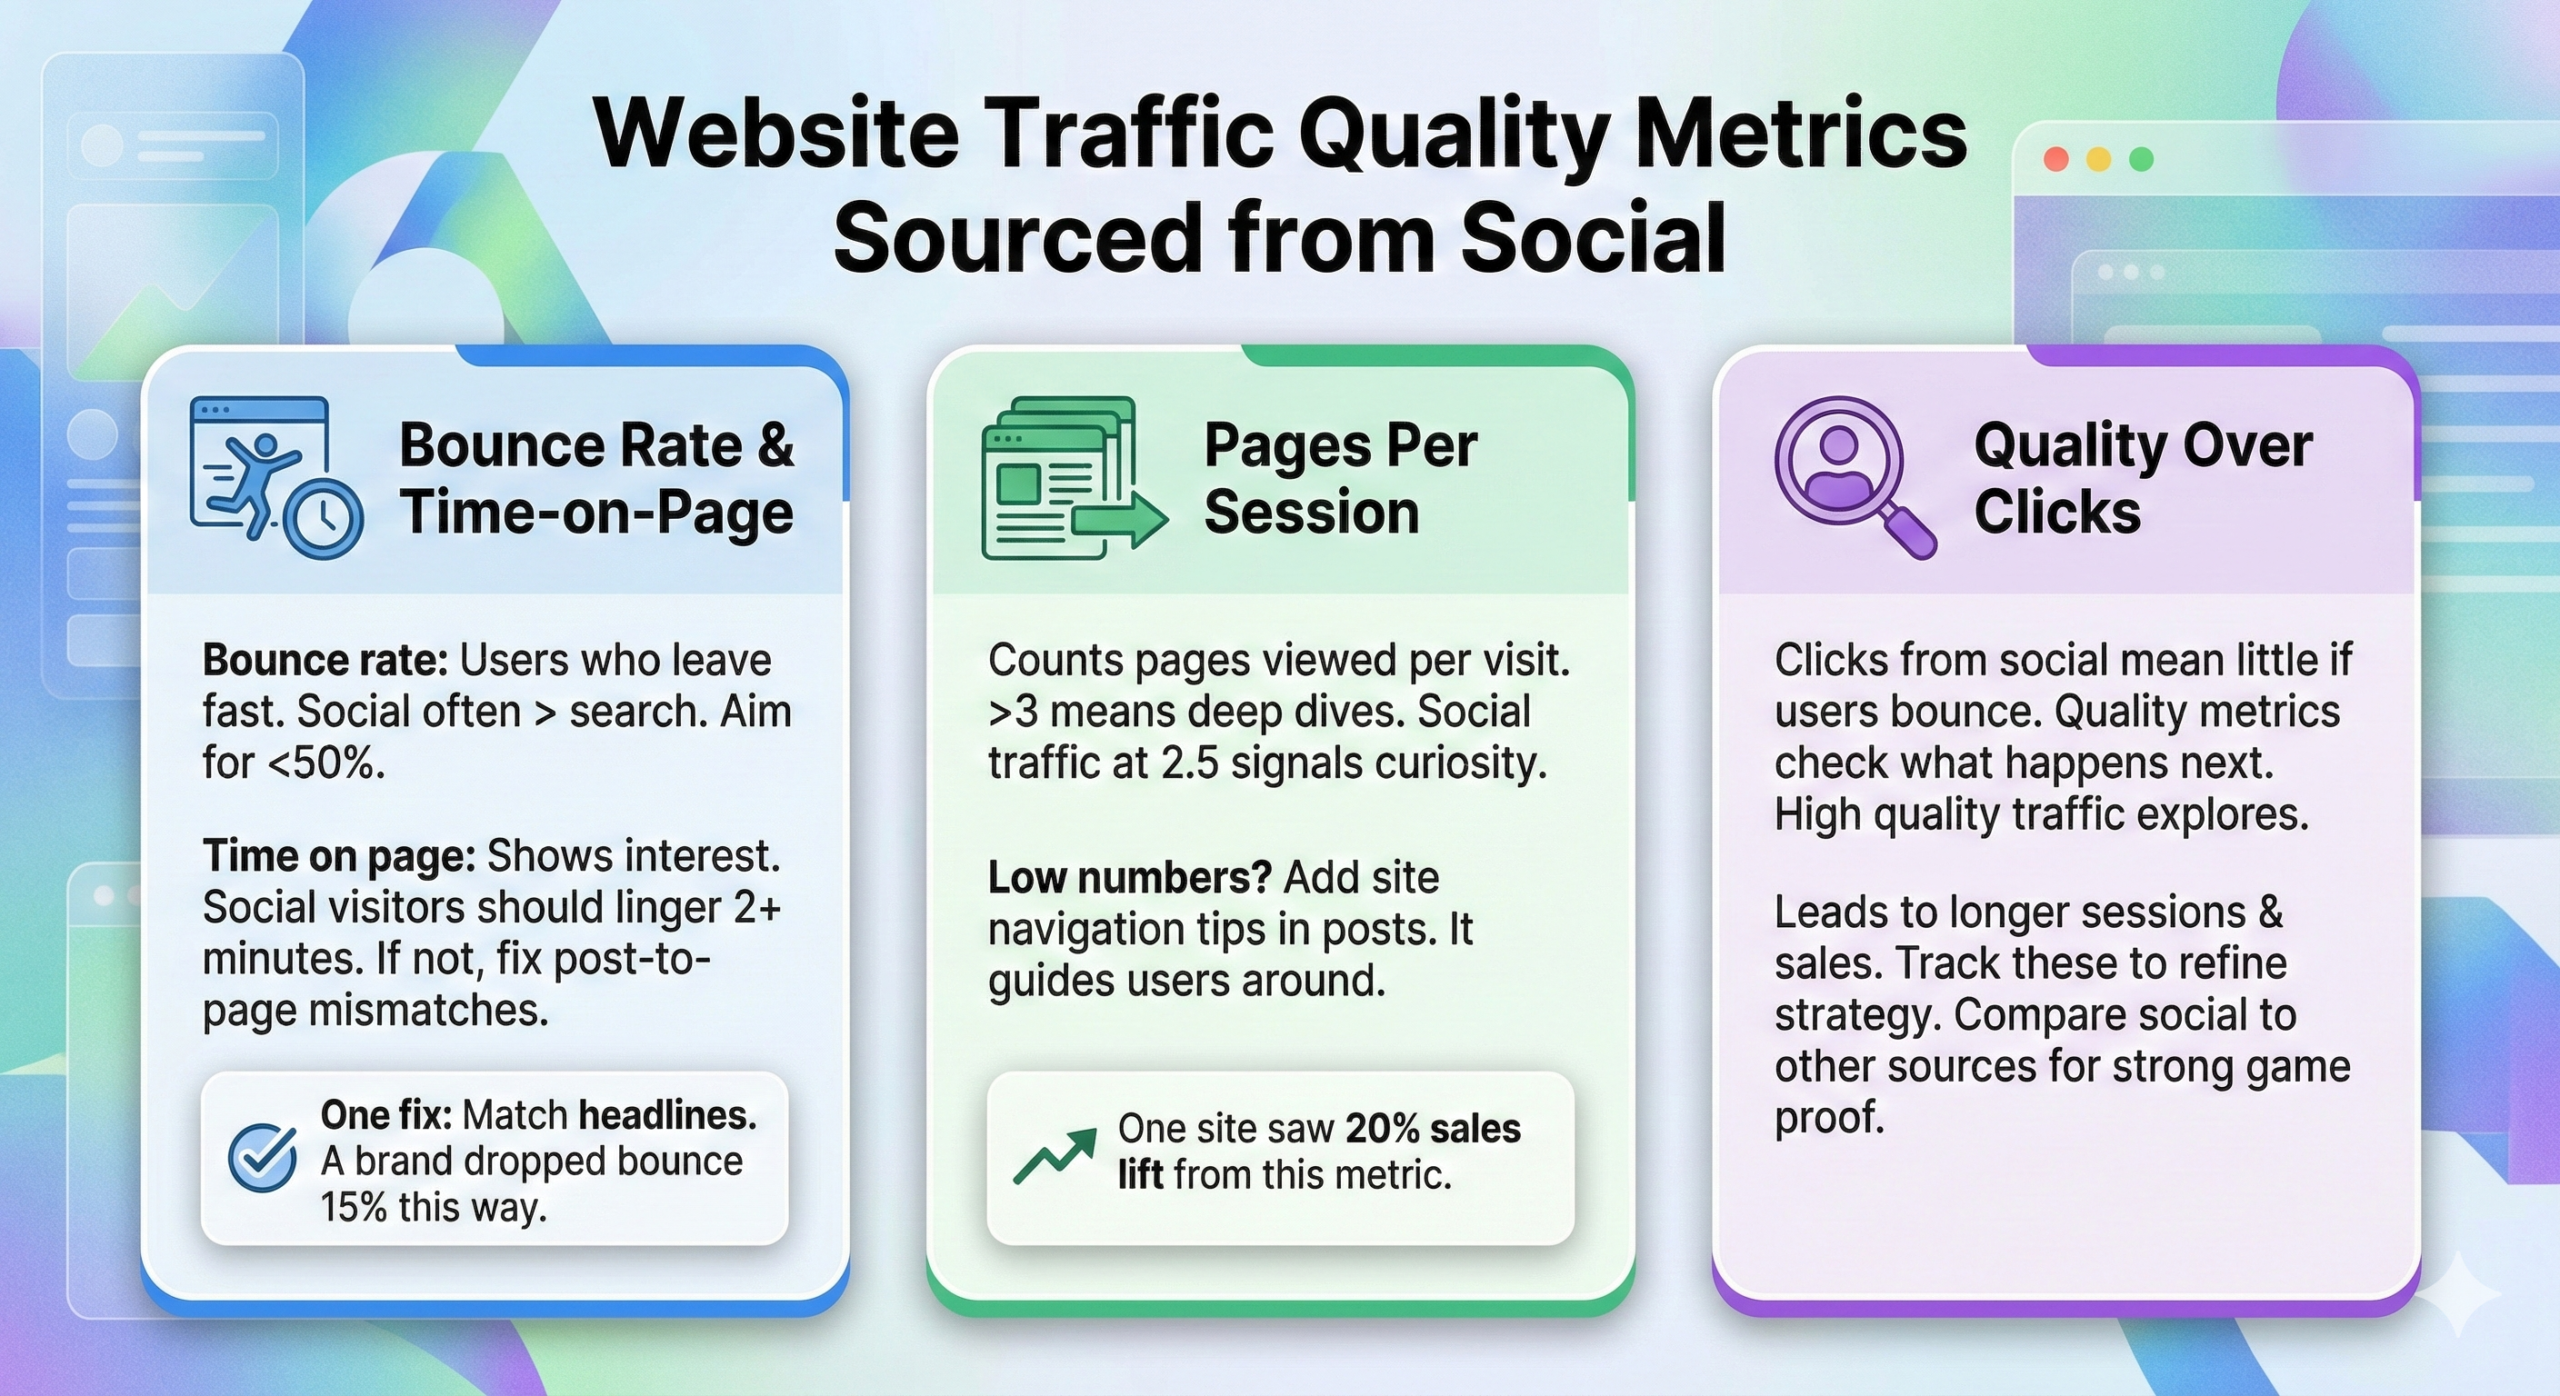
Website Traffic Quality Metrics Sourced from Social
Clicks from social mean little if users bounce. Quality metrics check what happens next. They show if your posts match site content.
High quality traffic explores. It leads to longer sessions and sales. Track these to refine your strategy. Compare social to other sources. Better numbers prove your social game is strong.
Bounce Rate and Time-on-Page Comparison
Bounce rate is users who leave fast. Social traffic often bounces higher than search. Aim under 50%. Time on page shows interest. Social visitors should linger 2+ minutes. If not, fix post-to-page mismatches.
One fix: Match headlines. A brand dropped bounce 15% this way. Compare monthly for progress.
Pages Per Session from Social Referrals
- This counts pages viewed per visit. Over 3 means deep dives. Social traffic at 2.5 signals curiosity.
- Low numbers? Add site navigation tips in posts. It guides users around. Track in Google Analytics.
- Higher sessions tie to revenue. One site saw 20% sales lift from this metric.
Establishing a Data-Driven Social Media Dashboard
You now know the top five metrics for real social media wins. Engagement rate checks connections. Conversion rate links to revenue. Amplification rate spots advocates. Retention and deflection save support bucks. Traffic quality proves visits matter.
Build a simple dashboard.
Use tools like Google Data Studio. Pull these five weekly. Skip the fluff. Focus here, and your strategy shines. Start today. Watch your business grow from true impact.
FAQ (Frequently Asked Question)
Because they look impressive but do not directly show sales, revenue, or customer loyalty.
Engagement rate is key because it shows how actively your audience interacts with your content.
It shows how many social media visitors take actions like buying a product or signing up.
It measures how often your audience shares your content, helping expand reach organically.
High-quality traffic stays longer, views more pages, and is more likely to convert into customers.